Cookies enable the best possible provision of our services. By using our site, you agree that cookies will be used.
Metrics for Prometheus and Grafana
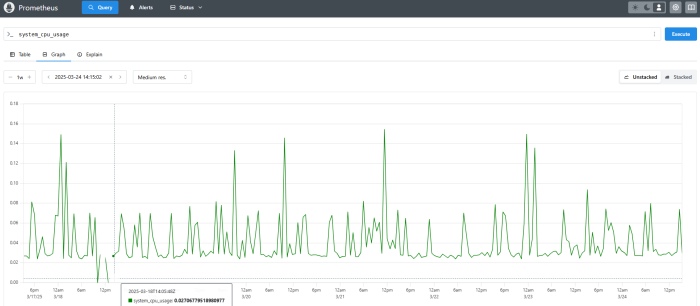
It is possible to provide various runtime metrics (e.g. CPU and memory utilisation of pirobase CMS) for Prometheus and Grafana.
Micrometer is used to provide the data.
Micrometer is an abstraction for various monitoring systems or metrics scrapers, such as Prometheus.
This requires an installed Prometheus and a configured metrics extension in the respective Smart View layout.
Metrics are provided via:
- CPU and memory utilisation.
- Amount of log messages per log level.
- Java thread and GC information.
- Duration and quantity of HTTP requests from page views, binary content elements and layout files.
External link
Login required