Template-Debugger
To set breakpoints is the most important function of a debugger. Through the debugging process you can take a look at each breakpoint and check which error has occured during the generation of a document. The template debugger gives you an insight into each sequential step of the template chain. This means, you can stop and review the rendering process of a template at any breakpoint of the selected mode (EDIT, SAVE, PREVIEW or REPARSE).
Opening the debugger#
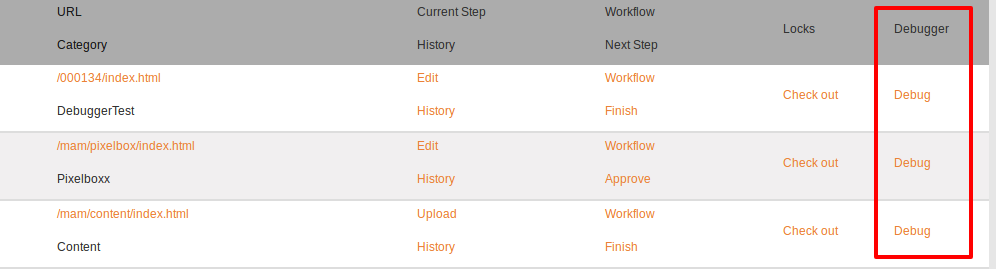
Add the column "Debugger" to your desktop view. How to do this, see user manual.
The debugger interface#
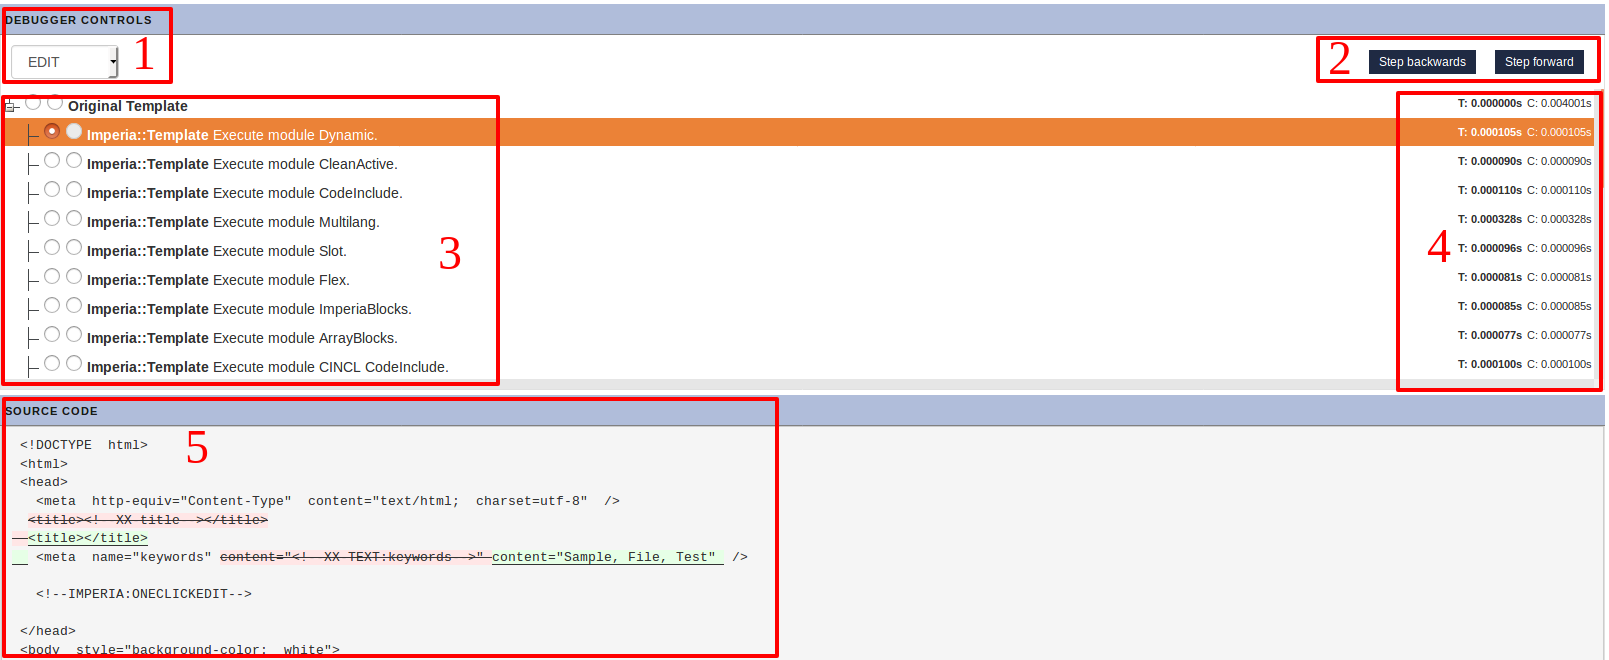
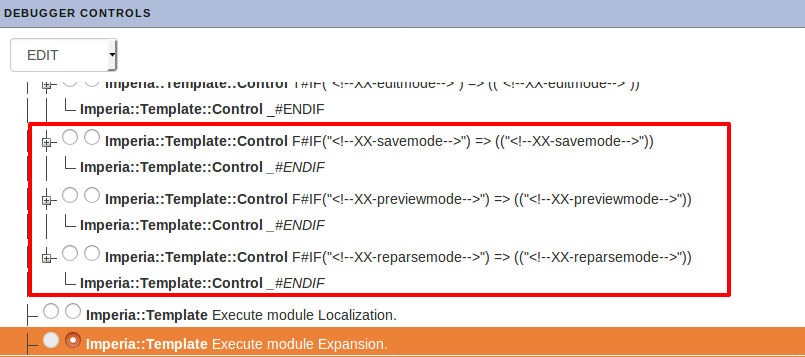
- In the drag-and-drop menu you can choose the mode (i.e. edit, save, preview or reparse).
- Using the Buttons
 you can navigate in the list of breakpoints forth and back.
 - Here you see each step of the template. You can set breakpoints for two of the steps.
-
The timestamp column is divided into:
- T: that specifies the time duration required to execute the process
- S: that indicates the sum of the time
-
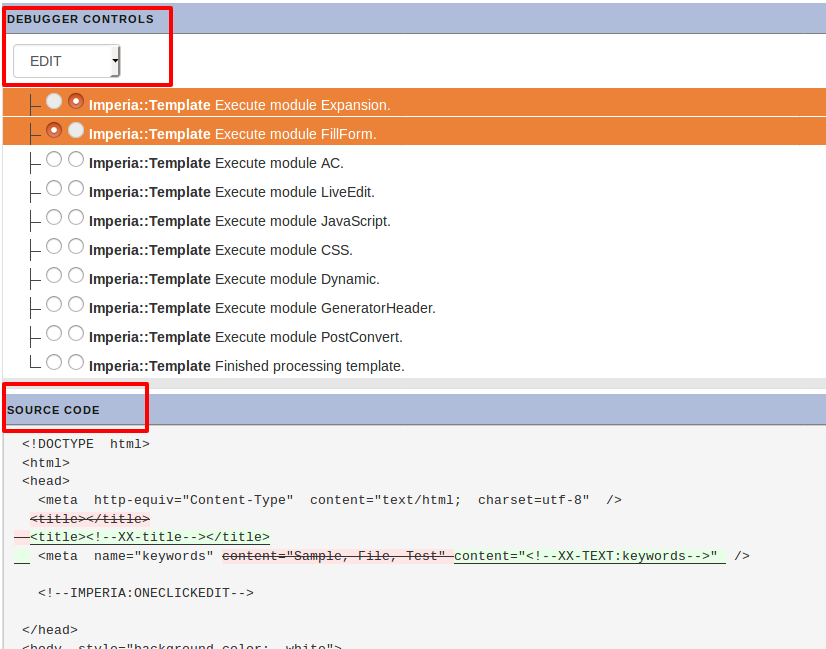
Here you see the source code of the selected breakpoints in comparison to each other.
To debug a template#
-
Select the mode (EDIT, SAVE, PREVIEW or REPARSE) of the rendering process you want to examine. If you select EDIT for example, this represents the last breakpoint of the edit mode. Select SAVE, if you want to examine the rendering process of the website.
-
Now you can navigate through the rendering process back and forth. You can see the outcome of the process in the area of the source text. Alternatevely you can compare conditions of the selected breakpoints by clicking on the field. In the source text area you can see the changes (highlighted in green and red) in a before-and-after comparison.
-
The time duration(T:) as well as the cumulated time (S:) is indicated in seconds for each breakpoint.
-
Some breakpoints can have sub-nodes.